Article
Market Volatility: Another Factor Driving Private Credit’s Expansion
Private credit’s expansion over the past several years has been well-telegraphed, driven by what we view to be a multi-faceted set of growth drivers that include: (1) investors’ desire for diversification and income, (2) borrowers’ desire for customization and partnership, (3) structural shifts in public debt and equity markets, and (4) an evolution in the bank lending landscape.
We believe another factor in private credit’s expanding universe of borrowers has been market volatility, which has been especially elevated over the past several months. In our view, such episodic volatility underscores the importance of certainty on financing execution and terms – something private credit seeks to provide to a wide range of companies, even when public debt markets are dislocated.


Elevated Market Volatility and the Read-Through for Private Credit
The second quarter of 2025 was a tale of two cities. Significant market volatility in the beginning of the quarter eventually gave way to a more benign market backdrop as the quarter closed. While this past quarter was one of the more pronounced examples of starkly different market regimes within a compressed period, the theme of elevated market volatility has been relatively persistent in the post-pandemic era as illustrated in this chart of the 10-day moving averages of widely tracked U.S. interest rate and equity market volatility measures.
10-Day Moving Averages of Interest Rate and Equity Market Volatility Measures1

We believe the second half of 2025 will likely be characterized by a somewhat more challenging growth-inflation mix in the U.S., alongside key deadlines and policy shifts related to trade, taxes, and fiscal policy. Episodes of macro volatility – which are inherently difficult to time – will, in our view, likely remain a prominent feature of the investing landscape.
Private Credit Amid Market Volatility
We see scope for a further shift in the structure of the lending landscape as a result of volatility. Specifically, we believe recent periods of episodic market volatility may act as a tailwind in further broadening the addressable market of borrowers accessing private credit for financing solutions – largely due, in our view, to private credit’s ability to provide certainty of execution and terms, flexibility, and customization across the capital structure.
The duration and severity of market volatility is an important factor, in our view. Even short bouts of volatility tend to reinforce the importance of certainty of execution for financing. Uncertainty and volatility lasting months (as opposed to weeks) would likely make it more difficult for businesses to ‘wait it out’ – especially if they have time-sensitive funding needs such as near-term capital expenditures, expansion plans, or acquisitions to fund. As a result, firms in this situation may increasingly turn to private credit for financing, even if it may result in paying a premium to achieve the desired speed, flexibility, and clarity around funding options.
One of the key implications that we expect for corporate credit – across liquid and private markets – is an increase in fundamental and performance dispersion. Sector and issuer selection, company specific characteristics, and solid underwriting should gain increased importance in such a dynamic investing environment.
A Financing Continuum
We view private credit as a viable financing option for a wide range of companies in a variety of market conditions. Rather than operating in distinct silos, we see the financing mix between private credit, bank lending, and publicly traded (syndicated) debt markets as increasingly more fluid, ebbing and flowing depending on market conditions.
This fluidity has increased in recent years, as private credit has grown into a sizable, scalable, stand-alone asset class. Data from Preqin shows that experienced private credit managers (i.e., those with four or more vintages) have captured 86% of private credit fundraising since 2022.2 By contrast, new entrants in private credit have raised only 4% of private credit fundraising over the same period.2 In our view, these trends are reflective of the fact that allocators increasingly value scale, workout experience, and restructuring expertise amidst a higher cost of capital environment.
At the same time, the average private credit fund size has grown from $627 million in 2020 to $1.05 billion in 2024, with the largest managers able to raise funds exceeding $10 billion in size.3 Growing fund sizes have allowed private credit to fund larger transactions, reaching into areas it previously was not servicing. This includes larger borrowers – some of which have demonstrated access to the syndicated debt markets. Said differently, private credit is no longer reserved for smaller, niche financings, as it was in the earliest stages of its growth.
Private Loans Greater than $1B in the USD Market4

While this presents a structural tailwind for upper middle market and larger scale private credit borrowers, we still see a compelling opportunity across the core middle market. Smaller-sized borrowers are increasingly likely, in our view, to rely on private credit for incremental financing that is too small to be considered liquid in the syndicated credit markets (which are serving ever larger borrowers). We also believe these companies can benefit from the customized financing offered by private credit, as they move through the various stages of their growth journey.
Putting Private Credit’s Growth in Perspective
Private credit’s share of the broader leveraged finance market – inclusive of HY bonds and leveraged loans – has increased over the last decade plus. Of note, private credit captured outsized market share during periods of dislocation in liquid markets with 2022 being a prime example.
U.S. Private Credit Fundraising as a % of Total U.S. Leveraged Finance Issuance5
We also see scope for private credit to increase its share of the overall ‘lending pie’ in more benign market backdrops. 2024 was a good example of this, with a meaningful volume of broadly syndicated loans being refinanced into the direct lending market despite a constructive publicly traded leveraged loan market for most of the year, as illustrated in this chart.
New Issue Broadly Syndicated Loans (BSL) and Direct Lending (DL) Takeouts ($B)6

Our overall expectation is that the private vs. public mix will ebb and flow with market conditions, with private credit continuing to steadily gain market share across cycles, as it has done consistently following the Global Financial Crisis. We believe the key drivers of borrower interest in private credit include the relative certainty of execution and terms, the ability to provide a customized lending solution, generally faster execution, enhanced confidentiality, and a partnership-oriented relationship.
Nuances to Consider
A key factor in this pattern, in our view, is the certainty of execution that private credit can provide to borrowers in search of financing, offering clarity on the size, pricing, and terms. It can also offer customization in structure to complement the growth journey of a business.
We believe this certainty and clarity stands in contrast to the process typically used in the syndicated debt markets, which is dependent on sufficient risk appetite from investors to ‘cover’ a deal once it launches – and may or may not be in the range of what the company and its underwriters estimated for the cost of debt. For companies accessing syndicated debt markets for the first time, this ‘price discovery’ process can often result in even greater uncertainty, given the lack of comparable bonds and/or loans traded in the secondary market.
Additionally, exogenous market-wide events (e.g., geopolitical events, idiosyncratic developments with bellwether companies) can also dampen investor appetite in the syndicated debt markets without advance notice, which may be problematic for companies that need financing for near-term maturities, capital investments, or acquisitions.
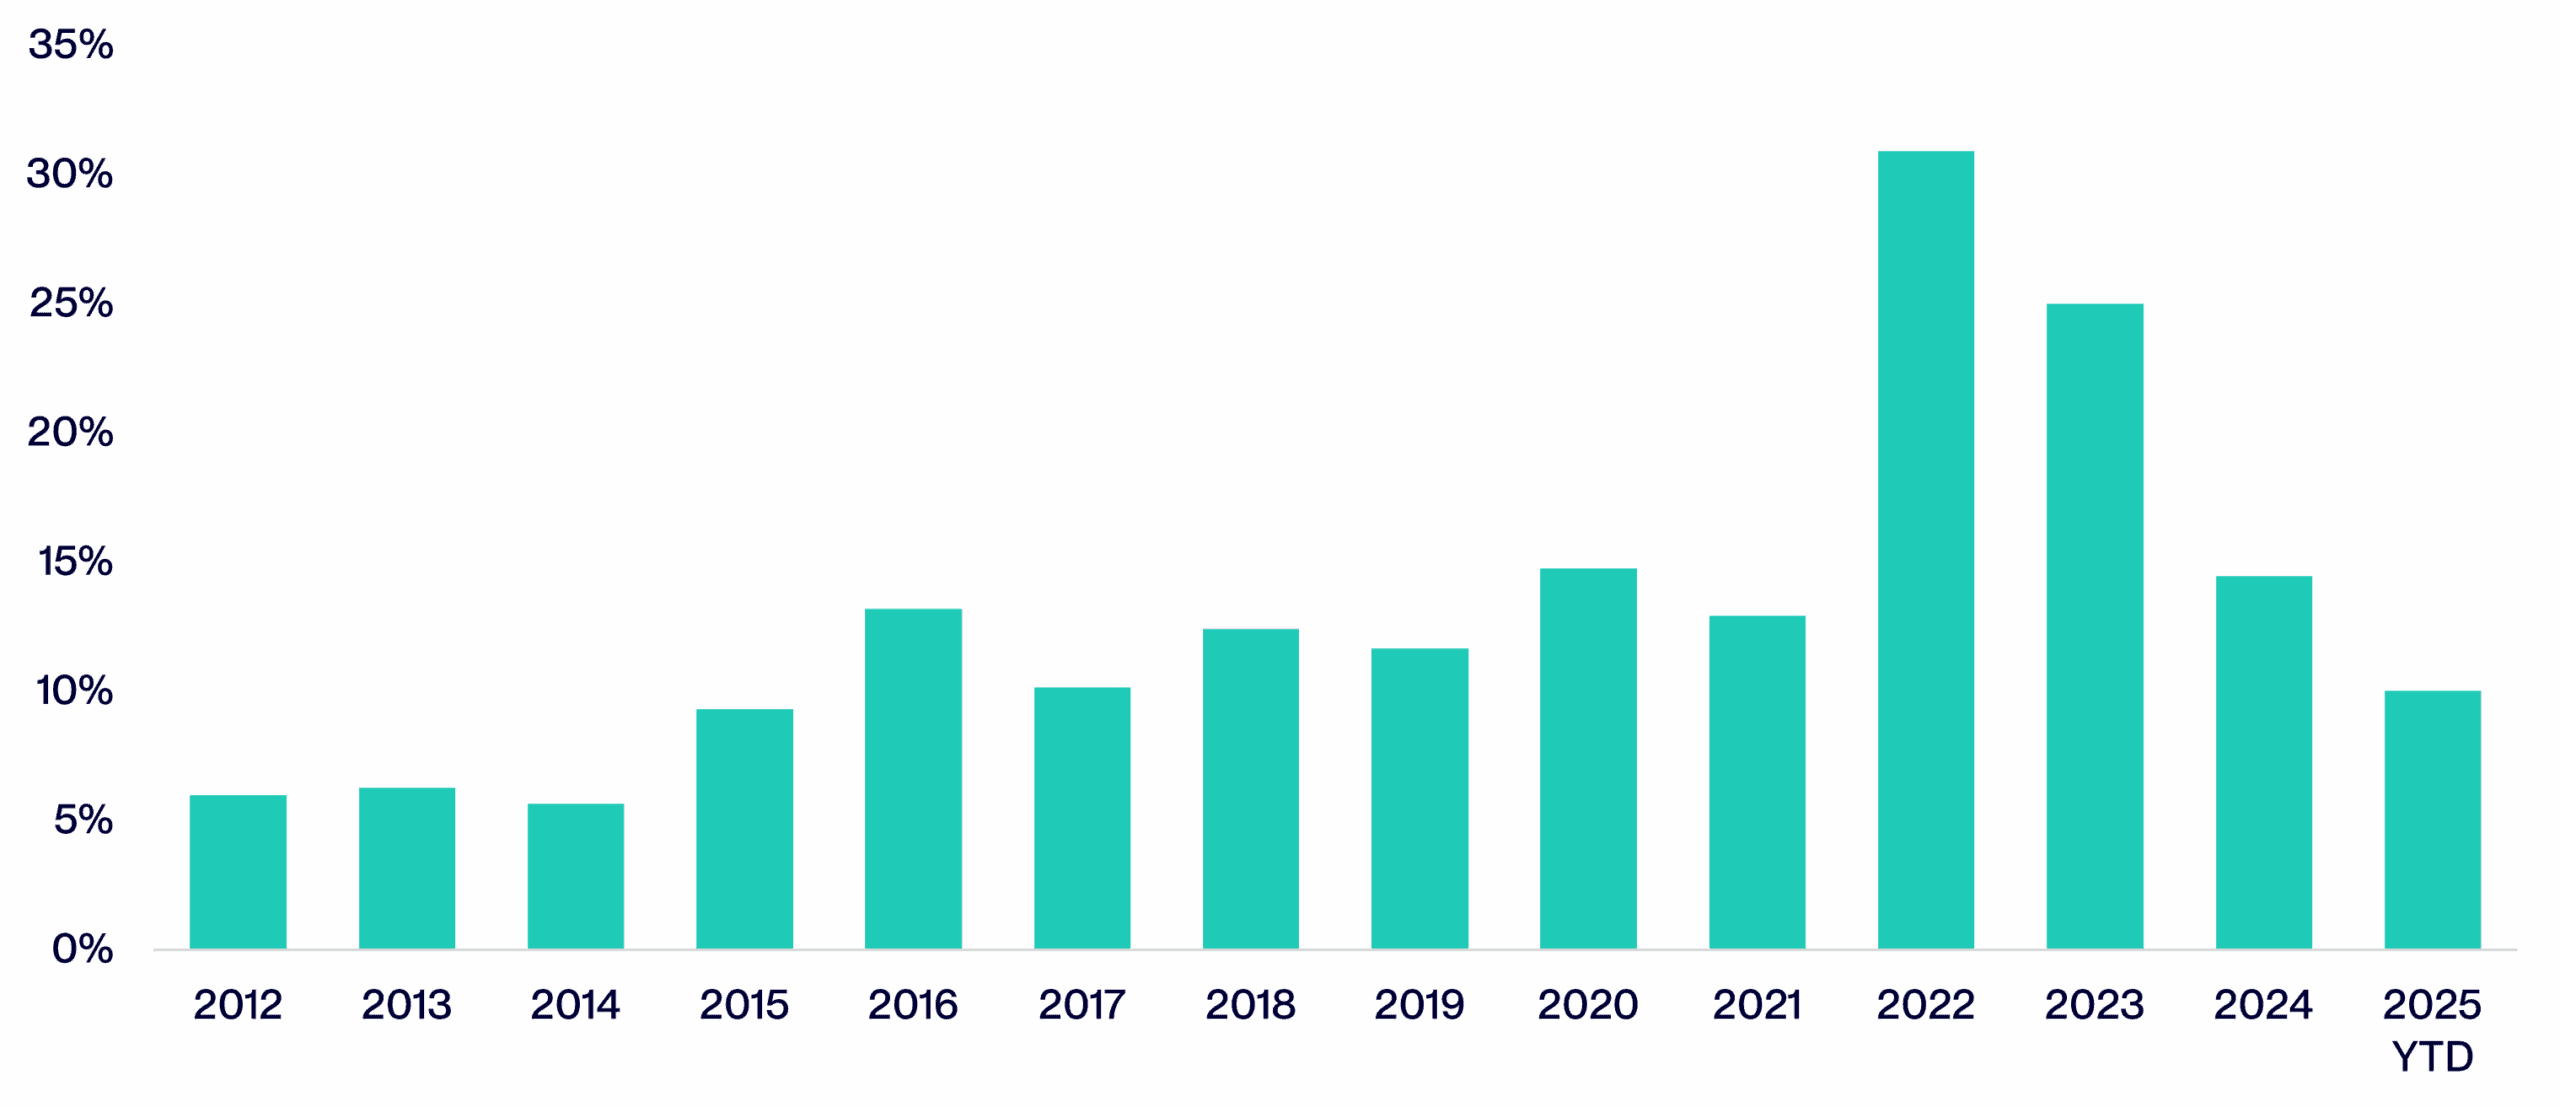
We believe technicals in the syndicated markets are also important to consider. Collateralized loan obligations (CLOs) represent a large share of the buyer base of leveraged loans and are rating sensitive vehicles, with restrictions on the amount of CCC-rated loans held in the CLO structures. In our view, during supportive market tones, this so-called ‘CLO bid’ can be a very favorable technical tailwind. However, during periods of market volatility, our observation is that CLOs tend to shy away from purchasing lower-rated loans, including those rated B-, due to concerns around downgrade risk into CCC territory.
The market’s fluctuating degree of receptivity to lower-rated borrowers is illustrated in this chart, which shows how the rating mix of issuance in the USD syndicated leveraged loan market can vary over time, dependent on market conditions.
Share of USD Syndicated Institutional Leveraged Loan Issuance Rated B- or Lower7

We believe such technical nuances can restrict the amount of capital available to lower-rated issuers in the syndicated market, historically providing an opportunity for private credit to step in as a lender to a wide range of companies in a variety of market conditions. In our view, private credit’s potential to offer scaled capital and bespoke solutions (across the capital structure) when liquidity is scarce is beneficial to increasing borrowers’ ability to access financing.
Additionally, while not directly related to the syndicated debt market process, we have observed that bank lending standards tend to tighten during periods of market volatility, as the periodic surveys from the Federal Reserve and European Central Bank show. In our view, this further underscores the importance and benefit of having a wide range of financing options to fund economic activity.
Private Credit Isn’t Immune to Potential Growth Headwinds
While we see ample room for private credit’s addressable market to expand, it is important to note that, as a risk asset exposed to the fluctuations in economic activity and corporate profitability, private credit is not immune to a potential growth slowdown. With that in mind, we use historical data to assess how private credit has performed across a mix of investing regimes and recent market cycles.
We first start with the Cliffwater Direct Lending Index (CDLI), which is an asset-weighted index of approximately 19,000 directly originated U.S. middle market loans totaling $465 billion. Using the CDLI, which includes a range of credits from first lien senior secured to junior capital, we find that private credit realized annual loss rates have averaged 0.94% over the past five years and 1.04% over the last 10 years.8 As illustrated in this chart, the realized loss rate of the CDLI has been modest, on an absolute basis, compared to its own income generation.
Trailing 12-Month Income Return and Realized Gains (Losses)8

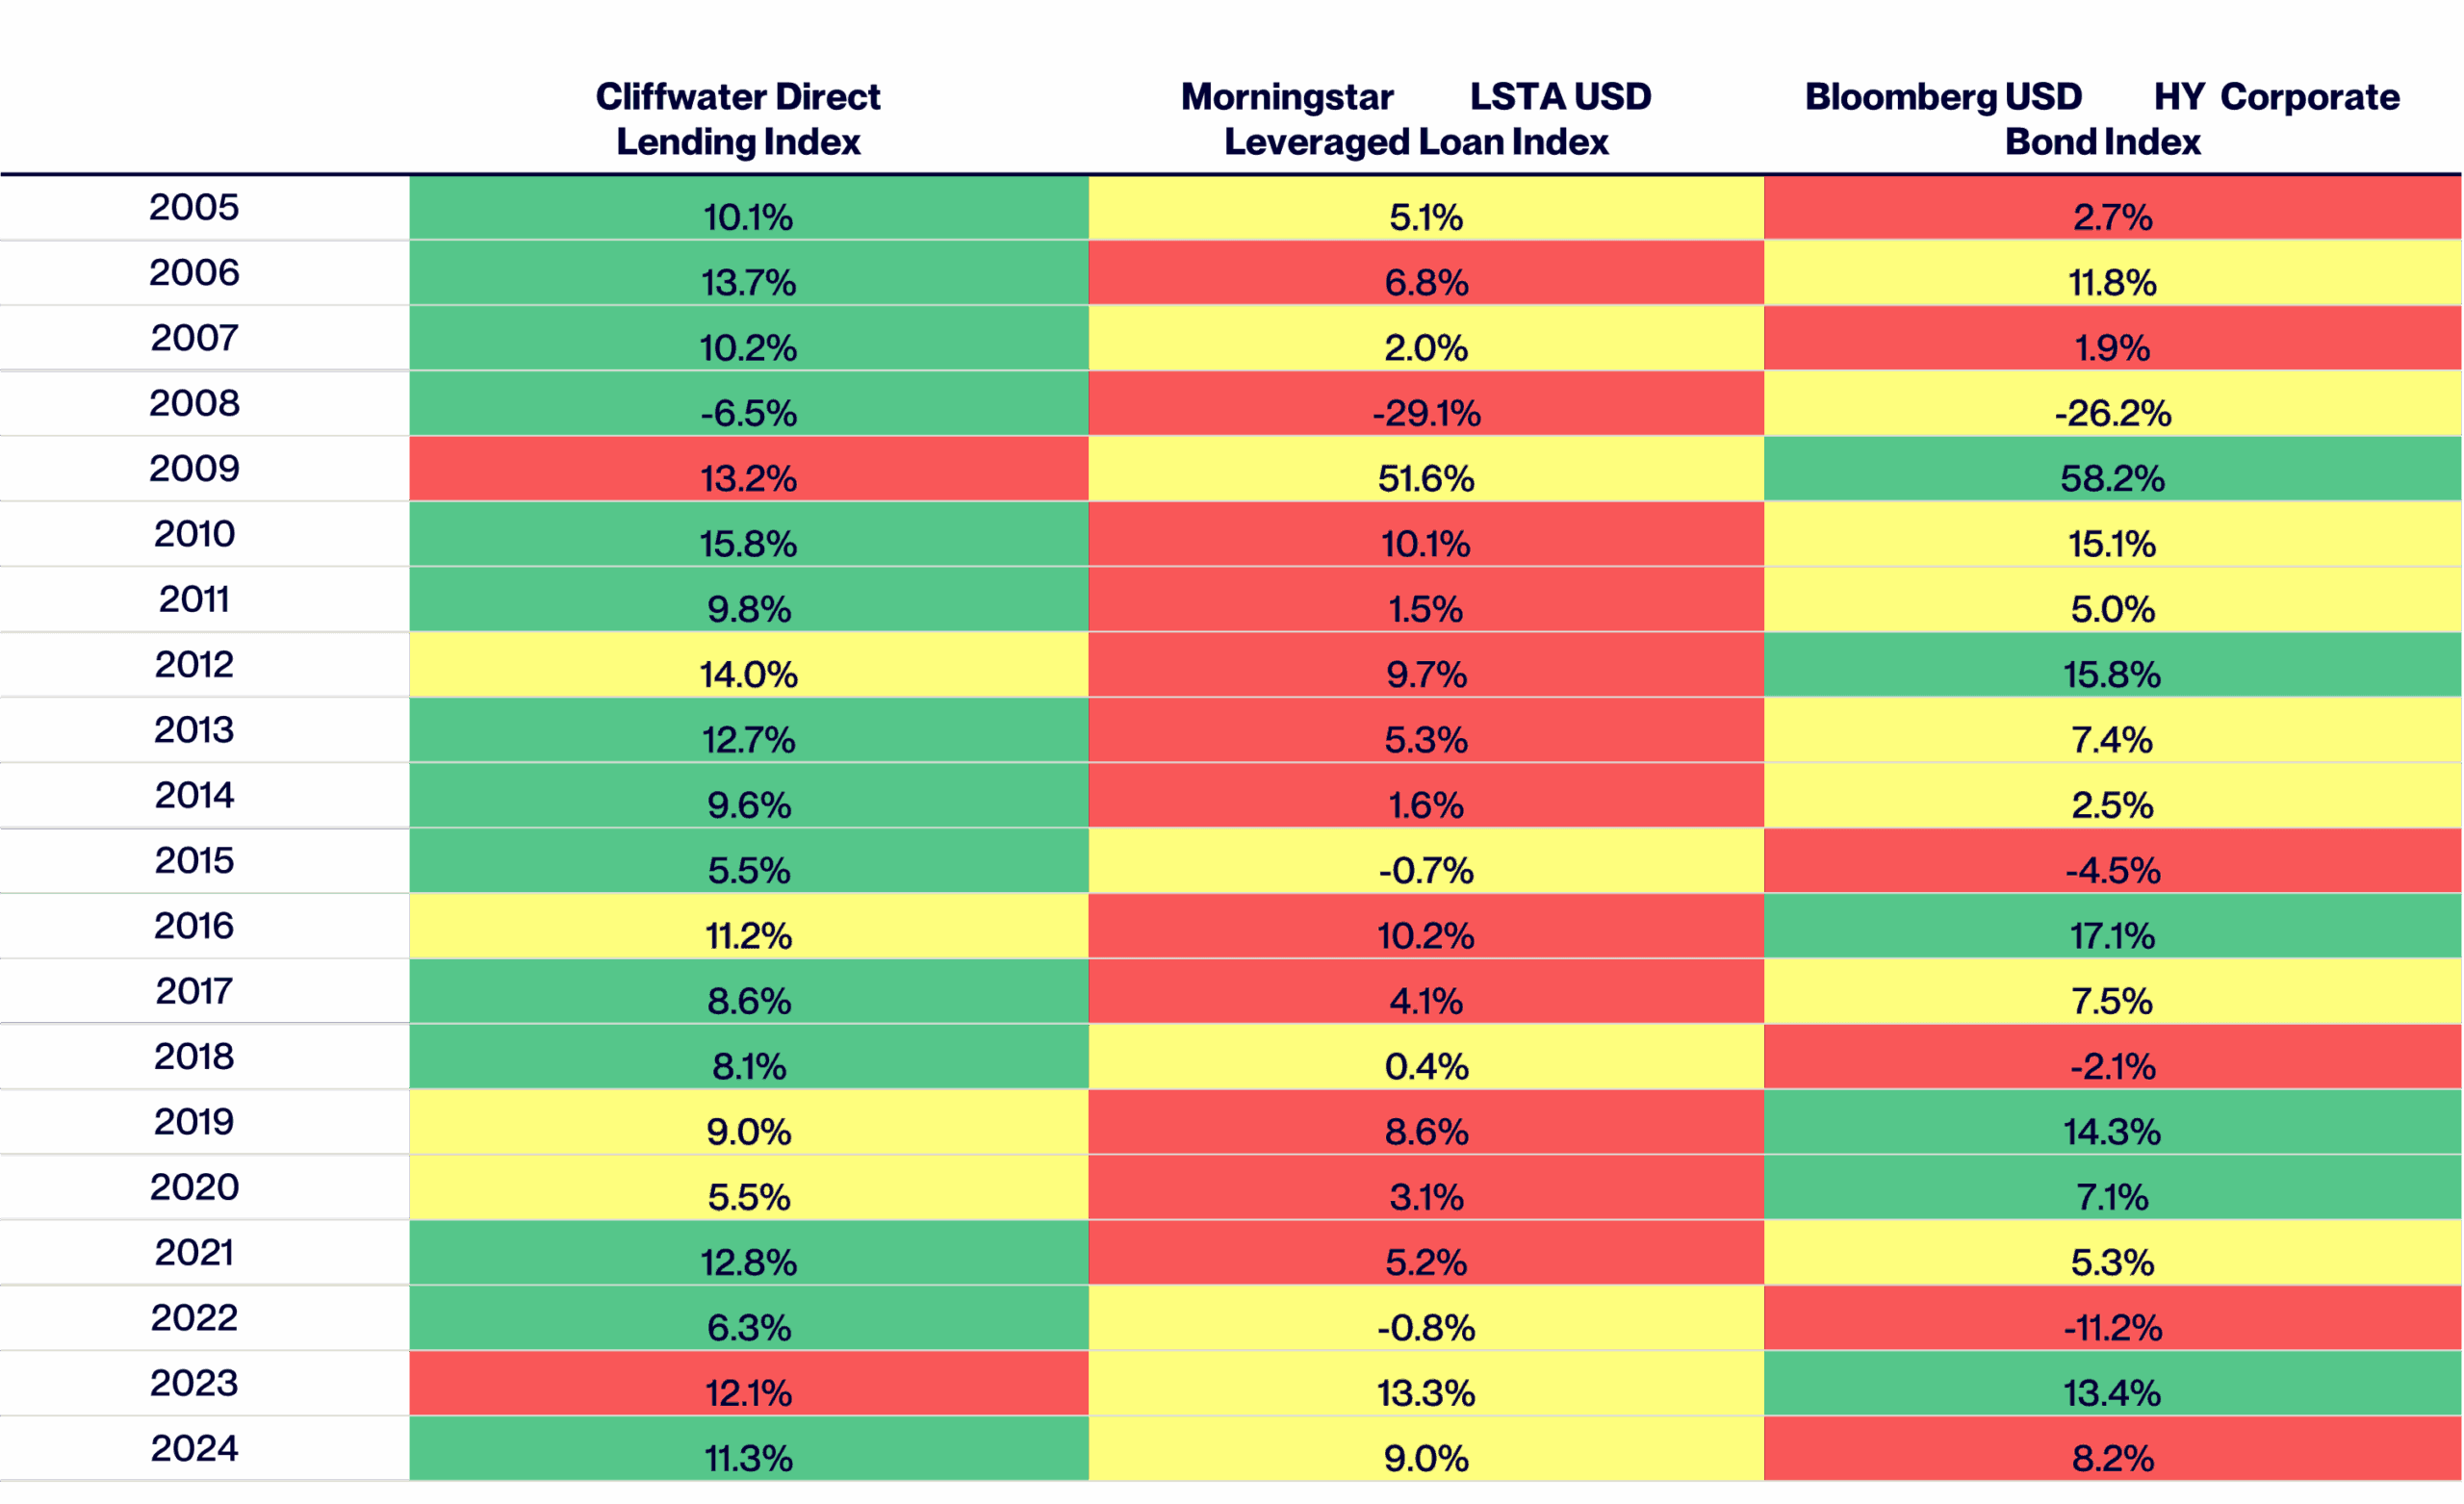
Over the same 10-year period, the CDLI index has generated an average yield-to-maturity premium of 3.95% relative to the leveraged loan market, as represented by the Morningstar / LSTA USD Leveraged Loan Index.9 As a result, total returns for the CDLI (which are inclusive of losses) have compared favorably with public debt markets – outperforming both the Morningstar / LSTA USD Leveraged Loan Index and the Bloomberg USD HY Corporate Index over the past five and 10 years.
Total Return Comparison for Calendar Years 2005 – 2024 for Each Period10
(Green = Best Performer and Red = Worst Performer)
Still, we believe an environment marked by significant policy shifts and residual uncertainty is likely to result in elevated dispersion at both the corporate and fund level. This chart illustrates one example of company performance dispersion that is widely tracked: EBITDA growth by company size. Company performance dispersion is also visible across other factors, such as industry focus areas.
Year-over-Year LTM Adjusted EBITDA Growth by Company Size11

The concept of performance dispersion is also visible at the fund level, driven by factors such as the broader opportunity set of origination, underlying credit selection, underwriting approach, structuring protections, and vintages of capital deployment. Looking at business development companies (BDCs) captured by the Cliffwater Direct Lending Index, we see BDC manager performance dispersion increased in 2023 and 2024, which we view as reflective of the headwind posed by a sustained period of elevated interest rates.
Trailing 12-Month Net Realized Gains (Losses) for BDCs and the Cliffwater Direct Lending Index12

Conclusion
In conclusion, we believe private credit is poised to expand its addressable market of borrowers and capture a larger share of the broader leveraged finance market over time. In our view, ongoing levels of heightened market volatility will likely accelerate this trend, as private credit’s value proposition – of certainty, customization and a partnership-oriented approach – is likely to be increasingly valued by borrowers. We also believe the underlying macro-economic uncertainty that is driving market volatility is also likely to result in greater dispersion of both corporate and fund performance, placing a premium on manager’s credit selection, underwriting, risk management, and workout / value enhancement capabilities.
End Notes
1 Source: ICE-BofA, CBOE, Bloomberg. As of July 1, 2025.
2 Source: Preqin. As of July 14, 2025.
3 Source: Preqin. As of July 1, 2025.
4 Source: KBRA DLD. As of May 31, 2025 (most recent as of July 1, 2025). Includes incremental amounts to existing financings that total $1 billion or more.
5 Source: Preqin, Dealogic (ION Analytics), Pitchbook LCD, BlackRock. As of July 11, 2025. USD leveraged finance issuance includes: (1) USD private credit fundraising per Preqin, (2) USD HY bond issuance per Dealogic (ION Analytics), and (3) USD institutional leveraged loan issuance per Pitchbook LCD.
6 Source: Pitchbook LCD. Data through June 30, 2025
7 Source: Pitchbook LCD, BlackRock. Captures data through June 30, 2025. Uses the loan rating (as opposed to the corporate family rating). Excludes ‘Not Rated’ issuance.
8 Source: Cliffwater Direct Lending Index. As of March 31, 2025 (most recent available). Realized gains in the CDLI can be driven by equity stubs, warrants, and gains on exited investments. These were more common in 2005-2007, when second lien and mezzanine loans were a greater portion of the CDLI. We exclude unrealized gains and losses in this chart. Long-term unrealized gains (losses) are approximately zero, as they either convert to net realized losses upon a credit default or are reversed when principal is fully repaid. The figures shown relate to past performance. Past performance is not a reliable indicator of current or future results. Index performance returns do not reflect any management fees, transaction costs, or expenses. Indices are unmanaged, and one cannot invest directly in an index.
9 Source: Cliffwater LLC, Bloomberg, Morningstar / LSTA, Pitchbook LCD. Private debt, leveraged loan and high yield as of 1Q2025. Chart shows yield-to-maturity for all three indices. The figures shown relate to past performance. Past performance is not a reliable indicator of current or future results. Index performance returns do not reflect any management fees, transaction costs or expenses. Indices are unmanaged, and one cannot invest directly in an index.
10 Cliffwater LLC, Bloomberg, Morningstar / LSTA, Pitchbook LCD. As of 1Q2025 (most recent available for the CDLI as of July 3, 2025). The figures shown relate to past performance. Past performance is not a reliable indicator of current or future results. Index performance returns do not reflect any management fees, transaction costs, or expenses. Indices are unmanaged, and one cannot invest directly in an index.
11 Source: Lincoln International Valuations & Opinions Group Proprietary Private Market Database. As of 1Q2025. “Company size” refers to annual EBITDA.
12 Source: Cliffwater Direct Lending Index. Data as of YE2024. Performance data represents past performance, which does not guarantee future results. There is no assurance that similar investments will be made or that similar results will be achieved.
Important Disclosures
PAST PERFORMANCE IS NOT NECESSARILY INDICATIVE OF FUTURE RESULTS. The data and information in this material, which has been prepared by HPS Investment Partners, LLC (“HPS”), are presented for informational purposes only. All charts, graphs and images are shown for illustrative purposes only. This material does not constitute an offer to sell or the solicitation of any offer to buy any interest, security, including any interests in any HPS managed funds or accounts, which offer can only be made by definitive offering documentation, which will contain material information with respect to any such interest or security, including risk factors relating to any such investment. All information provided herein is as of the date set forth on the cover page (unless otherwise specified) and is subject to modification, change or supplement in the sole discretion of HPS without notice to you. While this document expresses views as to certain investment opportunities and asset classes, HPS may undertake investment activities on behalf of one or more investment mandates inconsistent with such views subject to the requirements and objectives of the particular mandate. The investments and asset classes mentioned in this document can be highly illiquid, are speculative and may not be suitable for all investors. This document does not provide tailored investment advice and is primarily intended for distribution to institutional investors (as defined under (FINRA Rule 2210(a)(4)). Investing in such investments is only intended for experienced and sophisticated investors who are willing to bear the high economic risks associated with such an investment. Investors should carefully review and consider potential risks as well as their specific investment objectives and experience, time horizon, risk tolerance, and financial situation before making any investment decisions. Nothing contained in these materials constitutes investment, legal, tax or other advice nor is it to be relied on in making an investment or other decision. HPS makes no representation or warranty (express or implied) with respect to the information contained herein (including, without limitation, information obtained from third parties) and expressly disclaims any and all liability based on or relating to the information contained in, or errors or omissions (negligent or otherwise) from, these materials; or based on or relating to the recipient’s use (or the use by any of its affiliates or representatives) of these materials. This document may contain “forward-looking” statements. These are based upon a number of assumptions concerning future conditions that ultimately may prove to be inaccurate. Such forward-looking statements are subject to risks and uncertainties and may be affected by various factors that may cause actual results to differ materially from those in the forward-looking statements. Any forward-looking statements speak only as of the date they are made, and HPS assumes no duty to, and does not undertake to, update forward-looking statements or any other information contained herein. The success or achievement of various results and objectives is dependent upon a multitude of factors, many of which are beyond the control of HPS. The document may not be copied, reproduced, republished, posted, transmitted, distributed, disseminated, disclosed, quoted, or referenced, in whole or in part, to any other person without HPS’s prior written consent. Certain information contained herein, including indices and economic trends is, is based on or is derived from information provided by independent third-party sources. HPS believes that such information is accurate and that the sources from which it has been obtained are reliable; however, it cannot guarantee the accuracy of such information and has not independently verified the accuracy or completeness of such information or the assumptions on which such information is based. Any index information provided herein is included to show the general trend in the applicable markets in the periods indicated and is not intended to imply that the any investment product is similar to any index in composition or element of risk. The indices are not available for actual investment. No index is directly comparable to the investment strategy of any investment product. Moreover, independent third-party sources cited in these materials are not making any representations or warranties and do not guarantee the accuracy, completeness or availability of any information attributed to them and shall have no liability in connection with the use of such information in these materials, including for any errors or omissions (negligent or otherwise), regardless of the cause, or for the results obtained from the use of such content.
General/Loss of capital: An investment in the asset class or in investment vehicles that invest in the asset class described herein involves a high degree of risk. There can be no assurance that investors’ return objectives will be realized, and investors could lose up to the full amount of their invested capital. Limited liquidity: An investment in investment vehicles that invest in the asset class described herein may provide limited liquidity and interests in such vehicles may not be freely transferable or redeemable. There may be no secondary market for interests in such vehicles. Dependence on Manager: The manager of any investment vehicle that invests in the asset class described herein may have total trading authority over such vehicle. Decisions made by such manager may cause investors to incur losses or to miss profit opportunities on which they would otherwise have capitalized. Volatility: Investment techniques used by an investment vehicle that invests in the asset class described herein may include the use of leverage and derivative instruments such as futures, options and short sales, which amplify the possibilities for both profits and losses and may add volatility to such vehicle’s performance. Regulation: An investment vehicle that invests in the asset class described herein may not register as an investment company under the U.S. Investment Company Act of 1940 or similar laws or regulations. Accordingly, the provisions of such laws and regulations would not be applicable.
The foregoing risk factors do not purport to be a complete explanation of the risks involved in an investment in the asset class, or in investment vehicles that invest in the asset class, described herein. Investors in any security should read the entire offering materials of such security before making investment determinations.
Where applicable, this material has been distributed by HPS Securities LLC (“HPS Securities”), an affiliate of HPS and a broker/dealer registered with the U.S. Securities and Exchange Commission and member of the Financial Industry Regulatory Authority (“FINRA”) and the Securities Investor Protection Corporation (www.sipc.org). HPS Securities does not provide research reports.